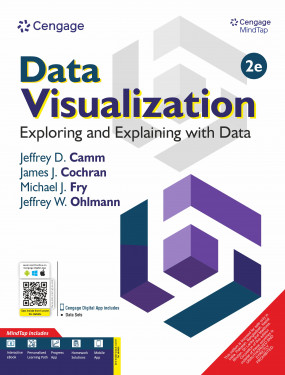
DATA VISUALIZATION: Exploring and Explaining with Data is designed to introduce best practices in data visualization to undergraduate and graduate students. This is one of the first books on data visualization designed for college courses. The book contains material on effective design, choice of chart type, effective use of color, how to both explore data visually, and how to explain concepts and results visually in a compelling way with data. The book explains both the "why" of data visualization and the "how." That is, the book provides lucid explanations of the guiding principles of data visualization through the use of interesting examples.
- Microsoft Excel is fully integrated, with step-by-step instructions for creating charts and tables.
- Tip Sheets for Tableau and Power BI are available in MindTap for recreating visualizations using those tools.
- Each chapter includes a Data Visualization Makeover, improving real-world charts using chapter principles.
- DATAfiles and CHARTfiles in Excel format are provided for hands-on practice and reference.
- End-of-chapter problems include both conceptual and application-based exercises to reinforce learning.
- Learning objectives at the start of each chapter clearly define expected outcomes.
- Notes and Comments offer extra insights, tips, and warnings throughout the text.
- MindTap platform includes an interactive eBook, auto-graded exercises, Excel activities, videos, and visualizations.
1. Introduction.
2. Selecting a Chart Type.
3. Data Visualization and Design.
4. Purposeful Use of Color.
5. Visualizing Variability.
6. Exploring Data Visually.
7. Explaining Visually to Influence with Data.
8. Data Dashboards.
9. Telling the Truth with Data Visualization.
Jeffrey D. Camm
Jeffrey D. Camm is the Inmar Presidential Chair and associate dean of business analytics in the School of Business at Wake Forest University.
James J. Cochran
James J. Cochran is associate dean for research, professor of applied statistics and the Rogers-Spivey Faculty Fellow at The University of Alabama.
Michael J. Fry
Michael J. Fry is professor of operations, business analytics and information systems (OBAIS) and academic director of the Center for Business Analytics in the Carl H. Lindner College of Business at the University of Cincinnati.
Jeffrey W. Ohlmann
Jeffrey W. Ohlmann is associate professor of business analytics and a Huneke Research fellow in the Tippie College of Business at the University of Iowa.